Tables
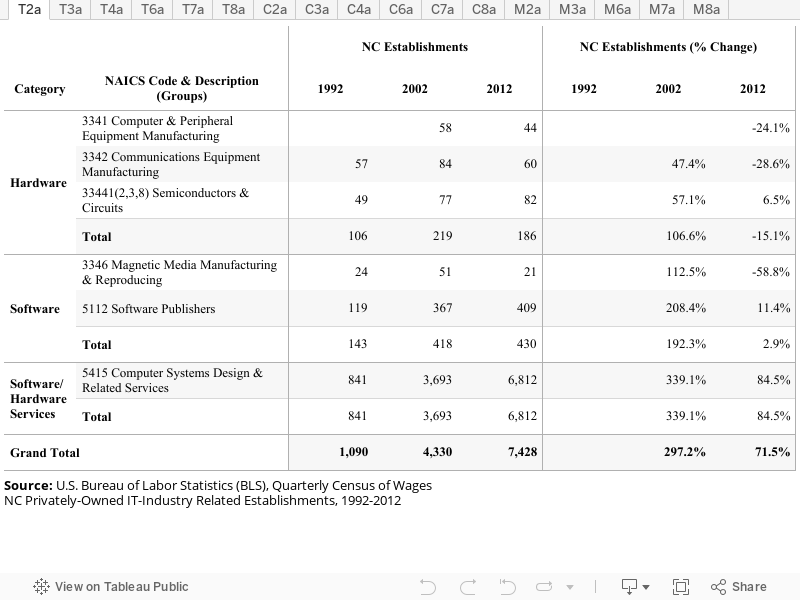
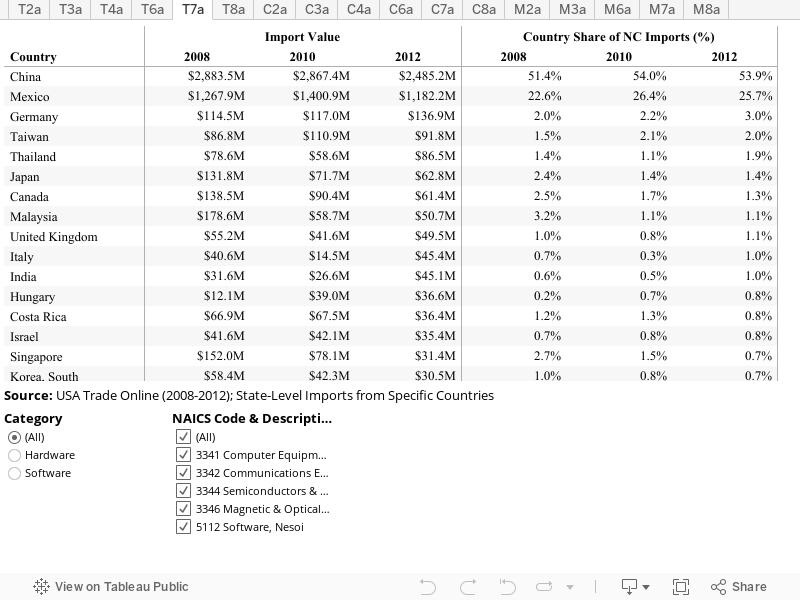
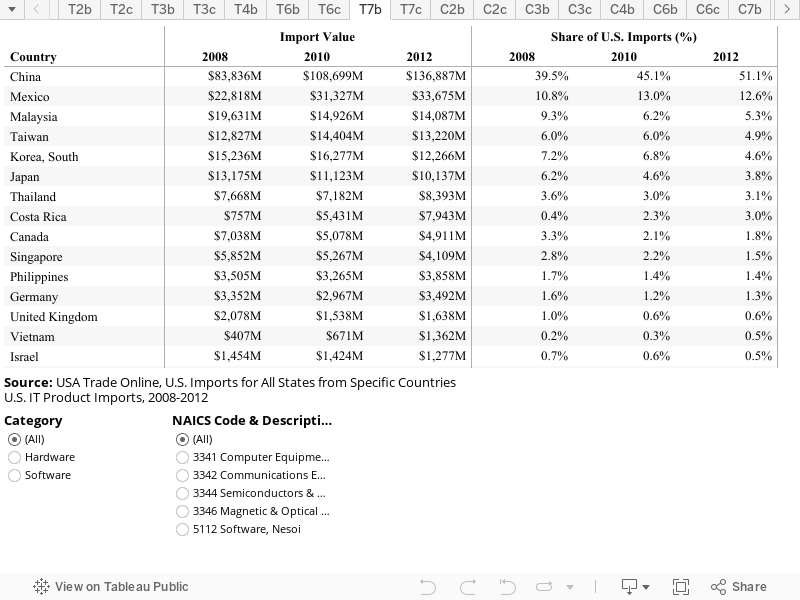
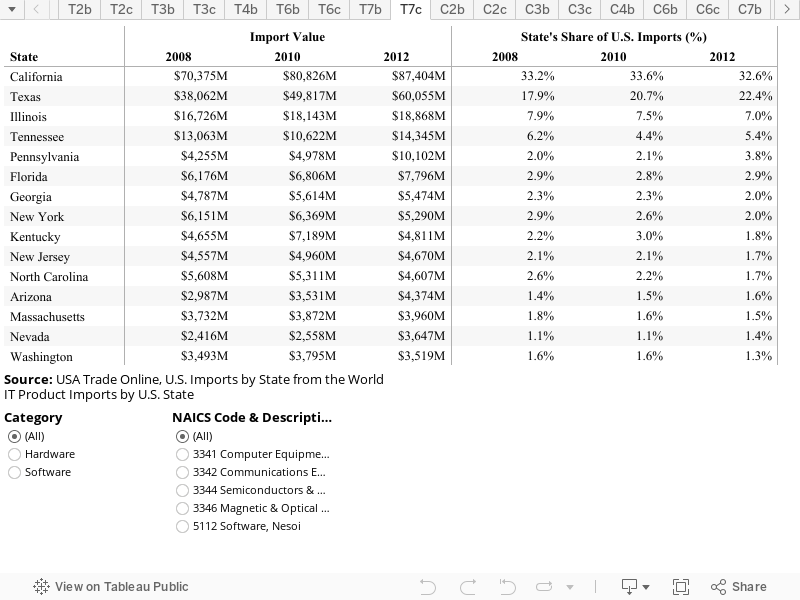
This page includes data in table format on various topics for the information technology industry. These tables are referenced with hyperlinks throughout the other sections of this industry, but are also all listed here for comparative purposes. The labeling system for the tables, charts and maps as follows is the same for each industry in which information is available: establishments (T2), employment (T3), average annual wages (T4), exports (T6), imports (T7) and layoffs/plant closings (T8) for North Carolina (Table "a"), the United States (Table "b") and top U.S. states (Table "c''). See the “Website Overview” for more details.
Information Technology: Table 1a: NC Top Employers
| Rank | Company Name | Headquarters | Primary NAICS | NC Locations | NC Employment | Total Employment | Total Sales ($US Mil) |
|---|---|---|---|---|---|---|---|
| 1 | IBM | Armonk, NY | 541512 | 11 | 9,100 | 43,4246 | $10,4507 |
| 2 | SAS Institute | Cary, NC | 511210 | 3 | 5,197 | 13,442 | $2,870 |
| 3 | Lenovo Group | Beijing, China | 334111 | 2 | 2,500 | 35,000 | $33,873 |
| 4 | Cree | Durham, NC | 334413 | 3 | 2,045 | 6,120 | $1,386 |
| 5 | Microsoft | Redmond, WA | 511210 | 2 | 2,030 | 99,000 | $77,849 |
| 6 | NetApp | Sunnyvale, CA | 334112 | 1 | 1,500 | 13,060 | $6,332 |
| 7 | Danaher Corporation | Washington, DC | 334515 | 1 | 1,075 | 63,000 | $18,260 |
| 8 | General Dynamics | Falls Church, VA | 336414 | 11 | 1,330 | 92,200 | $31,513 |
| 9 | Static Control Components | Sanford, NC | 334118 | 1 | 1,190 | 1,200 | $191 |
| 10 | A4 Health Systems and Allscripts (Allscripts Healthcare Solutions) | Chicago, IL | 511210 | 2 | 1,000 | 7,100 | $1,446 |
Sources: Dun & Bradstreet’s Hoover’s Online Pro database, secondary news sources and personal communication. Total sales and total employment represent data for the entire corporation. See the FAQ question for additional details.