Maps
This page includes data in map format on various topics for the biotechnology industry. These maps are referenced with hyperlinks throughout the other sections of this industry, but are also all listed here for comparative purposes. The labeling system for the maps is the same for each industry in which information is available: establishments (M2), employment (M3), exports (M6), imports (M7) and layoffs/plant closings (M8) for North Carolina (Map "a"), the United States (Map "b") and top U.S. states (Map "c''). See the “Website Overview” for more details.
The color shade in the establishments and employment maps reflect the relative share of labor market activity in NC counties and U.S. states by the selected year and value chain stage, category or NAICS code. Data is presented using a sequential color scheme in which geographic areas with lower data values are represented by lighter shades and higher values are represented by darker shades. By clicking or positioning the mouse over a county or a state you can see the name of the county, the number of establishments or employment, and the year. In the maps on exports and imports, the color scheme is also sequential; darker shades indicate greater shares of the overall import or export value for NC, the U.S. or other top U.S. states. Users can change the data displayed in the maps by using the slider to change the year (the default year is 2012) or selecting a new value chain sector or category from the lists provided below the maps.
Biotechnology: Map 2a: NC Establishments by County: 1992-2012
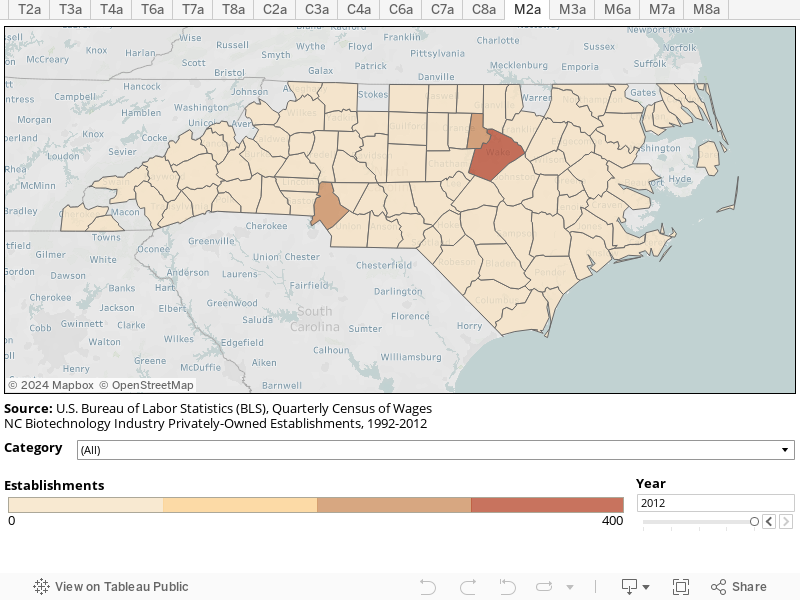
Table 2a: NC Establishments | Chart 2a: NC Establishments
Biotechnology: Map 2c: U.S. Establishments (by State): 1992 - 2012

Table 2c: U.S. Establishments (By State) | Chart 2c: U.S. Establishments (By State)
Biotechnology: Map 3a: NC Employment by County: 1992-2012

Table 3a: NC Employment | Chart 3a: NC Employment
Biotechnology: Map 3c: Top US Employment by State: 1992-2012

Table 3c: U.S. Employment (By State) | Chart 3c: U.S. Employment (By State)
Biotechnology: Map 6a: NC Export Destinations: 2002-2012

Table 6a: NC Export Destinations | Chart 6a: NC Exports By Type
Biotechnology: Map 6b: US Export Destinations: 2002-2012
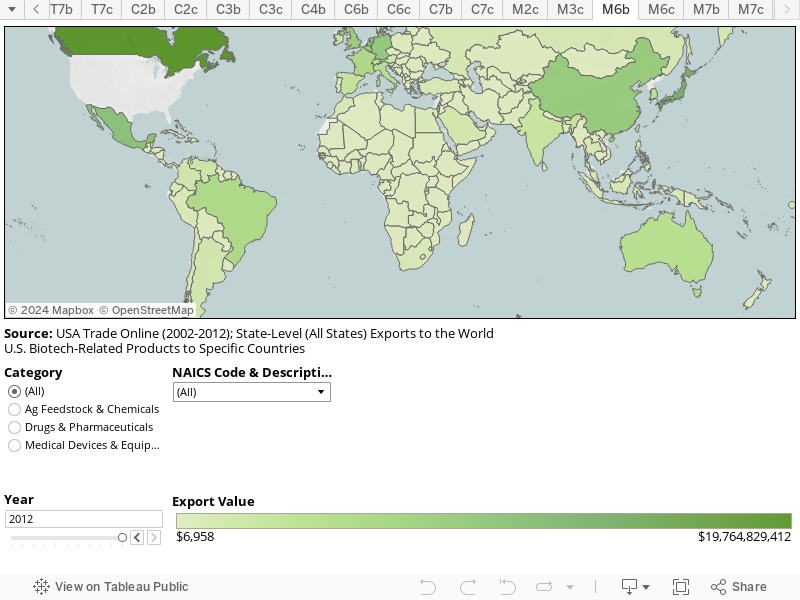
Table 6b: U.S. Export Destinations | Chart 6b: US Exports By Type
Biotechnology: Map 6c: Top US Exporters: Export Destinations: 2002-2012
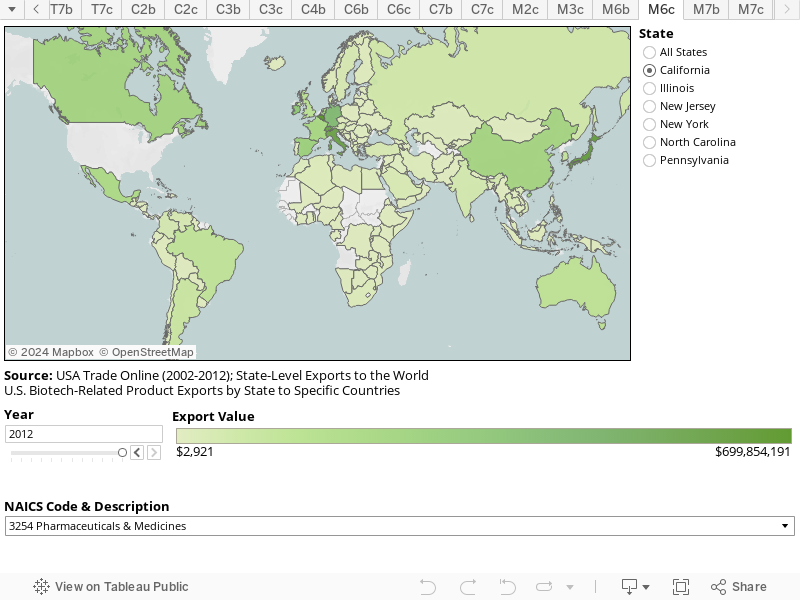
Table 6c: U.S. World Exports By State | Chart 6c: U.S. World Exports By State
Biotechnology: Map 7a: NC Import Countries: 2008-2012
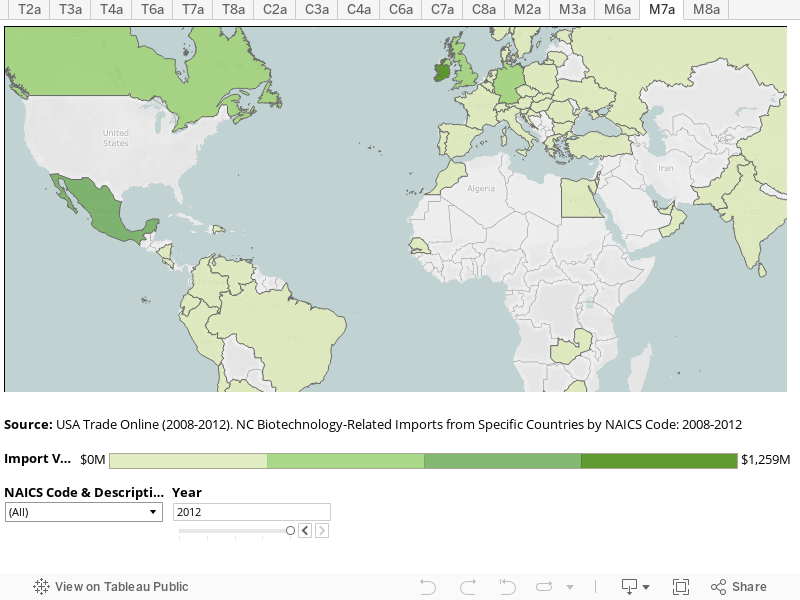
Table 7a: NC Import Countries | Chart 7a: NC Imports By Type
Biotechnology: Map 7b: US Import Countries: 2008-2012
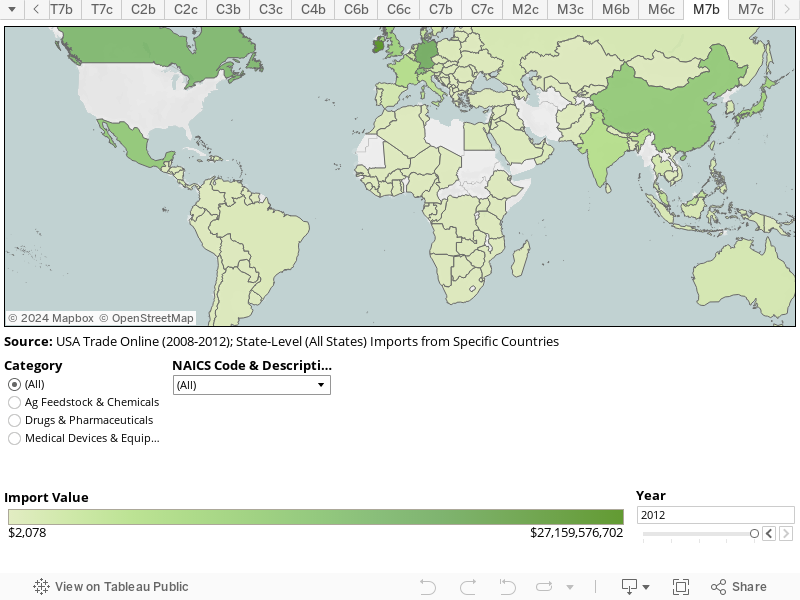
Table 7b: U.S. Import Countries
Biotechnology: Map 7c: U.S. Imports (by State): 2008-2012
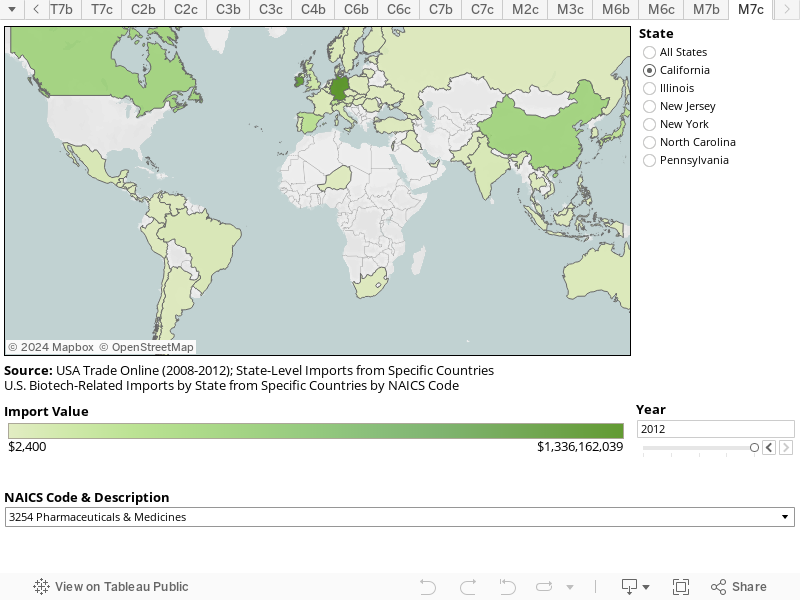
Table 7c: U.S. World Imports By State | Chart 7c: U.S. World Imports By State
Biotechnology: Map 8a: NC Layoffs & Closings: Affected Workers by County: 1989-2013
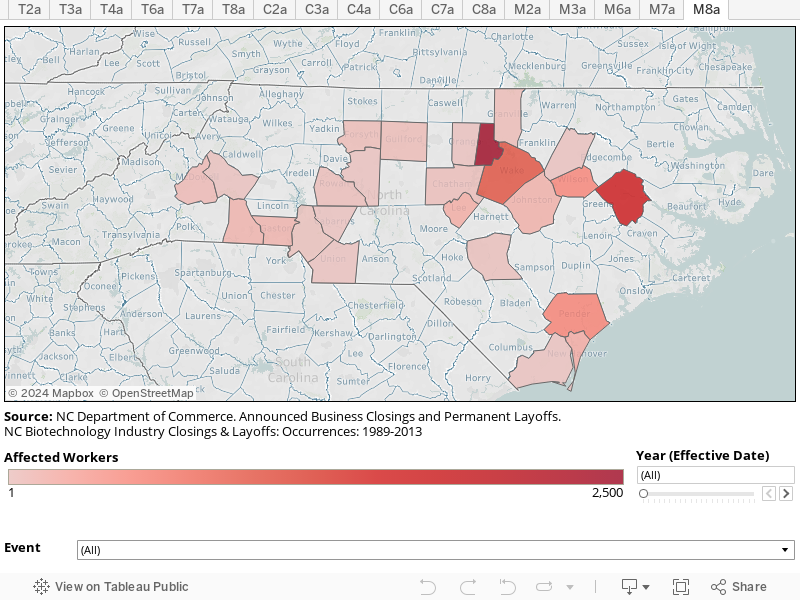
Table 8a: NC Layoffs & Closings | Chart 8a: NC Layoffs & Closings: Occurrences & Affected Worker